Empower Your Career with Technical Skills and A.I.-Driven Job Hunting Strategies to Land a Job in Data Analysis!
learn in-demand skills
Interview Readiness With AI
Land a Job in Data Analysis
WATCH THIS VIDEO FIRST! (AUDIO ON!)
I understand the challenges you face when trying to break into the data analysis industry. That’s why this course goes beyond just teaching you technical skills. We equip you with a holistic approach that combines essential technical training with cutting-edge artificial intelligence-powered job hunting strategies. It is not just a course, it is a system.
- The Foundations of Computing and Programming 2-hour video course covers fundamental programming principles like conditional statements, loops, and essential topics like cloud computing, operating systems, and programming language types.
- The Mathematics and Statistics in Data Science 2-hour video course equips you with the fundamental knowledge required for a career in data analysis or data science, covering key topics such as Probability theory, Descriptive and Inferential Statistics, as well as Linear Algebra and Calculus.
Each course is accompanied by quizzes and self-assessments strategically placed throughout the content, to reinforce your understanding of the course material by allowing you to actively apply what you’ve learned.
In the realm of data analysis, SQL proficiency opens doors to exciting career prospects. Our comprehensive SQL course is meticulously designed to equip you with the practical skills, industry-relevant applications, and in-depth knowledge necessary to excel in data analysis using SQL.
SQL expertise is highly sought after in today’s data-driven job market. According to industry reports, SQL-related job postings have grown significantly, with an average salary range of $70,000 to $120,000 per year. By mastering SQL, you’ll position yourself for career growth and advancement as a data analyst, data engineer, or database administrator.
Here’s what you can expect from this SQL Mastery course:
- Gain Practical Skills through Hands-on Experience: Our course emphasizes a hands-on approach, allowing you to work on exercises, projects, and real datasets. This practical experience will enable you to apply your SQL knowledge to real-world data analysis scenarios, preparing you for the challenges you may encounter in your career.
- Clear Explanation of Complex Concepts: I understand that learning complex concepts can be daunting. That’s why our instructors excel at explaining intricate SQL concepts in a clear and accessible manner. With their guidance, you’ll grasp even the most challenging aspects of SQL for data analysis.
- Direct Career Advancement: Acquiring skills that directly contribute to your career advancement is of utmost importance. Our course ensures that you gain the in-demand skills that employers value in the data analysis and data science fields. By mastering SQL for data analysis, you’ll position yourself for exciting career opportunities and professional growth.
- Comprehensive Coverage and Self-Paced Learning: Just like the highly rated courses, our curriculum provides comprehensive coverage of SQL for data analysis. You’ll learn essential SQL syntax, advanced querying techniques, and database manipulation to gain a solid foundation. Additionally, our self-paced learning options enable you to learn at your own convenience, ensuring a positive and personalized learning experience.
This SQL video course includes 4 labs
Lab #1: How to Query Data in Relational Databases
This comprehensive lab provides step-by-step guidance on the fundamentals of SQL statements and functions to filter, aggregate, and analyze data. Here’s what you can expect to:
- Learn how to use SELECT statements to retrieve data from specific columns in a database table. This includes selecting individual columns, selecting all columns using the wildcard, and using aliases to name columns.
- Learn how to use the WHERE clause to apply conditions and filter rows based on specific criteria. This involves using logical operators (AND, OR, NOT) and comparison operators (equals, not equals) to narrow down the data results
- Learn how to use the GROUP BY clause to group rows based on one or more columns. This allows you to perform aggregate functions like counting, summing, averaging, and finding minimum or maximum values within each group.
- Learn how to use the ORDER BY clause to sort the results of your queries in either ascending or descending order based on one or more columns.
The hands-on challenge or capstone project will provide you with a practical application of the concepts learned. You will apply your skills in querying data from the Northwind database as a sales executive, using basic SQL clauses such as SELECT, GROUP BY, and WHERE.
Upon completion of the lab, you will develop a strong foundation in querying data using SQL and be able to retrieve, filter, group, and order data effectively for analysis and reporting purposes.
Lab #2: How to Clean Data in SQL
This comprehensive lab provides step-by-step guidance on data cleaning techniques in SQL, equipping you with the necessary skills to handle duplicates, transform variables, and handle null values. Here’s what you can expect:
- Transform Variables: Use SQL functions to manipulate and transform variables in the dataset. This may include formatting dates, converting data types, or extracting specific information from columns.
- Detect and Remove Duplicates: Apply common table expressions (CTEs) and the row_number() function to identify and eliminate duplicate records in the dataset. This ensures that each observation is unique and prevents data redundancy.
- Clean Data: Utilize case statements to clean and standardize data values based on specific conditions. This may involve replacing or categorizing values, handling missing data, or creating new variables based on existing ones.
- Handle Null Values: Use the ISNULL() function to replace null values with appropriate replacement values. This ensures that missing data does not impact subsequent analyses and allows for consistent data handling.
The hands-on capstone project will provide you with a practical application of the concepts learned.
Upon completion of the lab, you’ll have the skills to efficiently clean and prepare data for analysis in SQL. You’ll be able to detect and remove duplicates, handle null values, and apply conditional transformations using case statements. With a solid understanding of common table expressions and the row_number() function, you’ll be equipped to break down complex queries and manage data more effectively. These skills will empower you to confidently tackle data cleaning tasks and ensure the quality and reliability of your data before diving into analysis.
Lab #3: Extract & Analyze Data from Databases
This lab equips you with the essential SQL skills needed to manipulate and analyze data efficiently.Through a series of instructional tasks, practice quizzes, and a hands-on challenge, you’ll gain proficiency in the following areas:
- Filtering Data: Extract and analyze data using SQL statements and functions, including the SELECT statement and WHERE clause for filtering based on specific criteria.
- Aggregating and Grouping Data: Utilize aggregation functions like COUNT, SUM, and AVERAGE to calculate and summarize data. Learn to use the GROUP BY clause to group data and the HAVING clause to filter grouped data.
- Joining Tables: Combine data from multiple tables using the INNER JOIN clause, leveraging common columns and aliases to establish relationships between tables
- Query Optimization: Optimize SQL queries for improved performance and readability, employing techniques such as aliases, proper column selection, and efficient usage of GROUP BY and HAVING clauses.
In this lab you’ll assume the role of a sales executive at Northwind Traders, an import-export company specializing in specialty foods. Your mission is to extract and analyze the data from the database using SQL.
By the end of this lab, you’ll be able to extract and analyze data from databases with ease. You’ll have a strong grasp of fundamental SQL statements and functions, enabling you to manipulate data, generate insightful reports, and derive valuable business insights.
Lab #4: Create Analyses from Multiple Queries
This comprehensive lab provides step-by-step guidance on combining and analyzing data from multiple queries. you’ll gain proficiency in the following areas:
- Explore the functionality of UNION and UNION ALL statements in SQL, allowing you to combine the results of multiple SELECT queries. Understand the differences between them, such as duplicate handling, and learn when to use each for effective result set merging.
- Dive into the world of SQL join operators, including INNER, OUTER, LEFT, and RIGHT joins. Learn how to combine queries by matching common columns or keys, and grasp the nuances of each operator, such as how they handle NULL values and non-matching data.
- Leverage Common Table Expressions (CTEs) in SQL to create reusable, organized query blocks. Discover how CTEs can enhance the readability and maintainability of complex queries, making your SQL code more efficient and manageable
In this lab, you’ll assume the role of a sales executive at Northwind Traders, a renowned import-export company specializing in specialty foods. Your mission is to extract and analyze sales data from the company’s ERP software, which contains a database with various tables for customers, orders, inventory, and purchasing.
Upon completion of the lab, you’ll have the skills to extract, combine, and analyze data from databases using SQL, empowering you to make data-driven decisions and derive valuable insights.
In the world of data analysis, effective data visualization is key to deriving actionable insights. Our course is meticulously designed to equip you with the practical skills, real-world applications, and comprehensive knowledge necessary to excel in data visualization using PowerBI/
Power BI expertise is in high demand in today’s data-driven job market. According to industry reports, job postings requiring Power BI skills have surged, offering an average salary range of $80,000 to $130,000 per year. By mastering Power BI, you’ll position yourself for career growth and advancement as a data analyst, business intelligence developer, or data visualization specialist.
Here’s what you can expect from this Power BI Mastery course:
- Gain Practical Skills through Hands-on Experience: Gain hands-on experience through interactive exercises and real-world projects. You’ll learn how to leverage PowerBI’s intuitive interface to create compelling visualizations that bring data to life.
- Clear Explanation of Complex Concepts: Our instructors are experts at explaining complex concepts in a clear and concise manner. You’ll dive deep into PowerBI’s features, learning how to transform raw data into visually appealing dashboards and reports that effectively communicate insights
- Real-world Applications: Explore real-world applications of PowerBI across various industries. From business analytics and sales reporting to data-driven decision making, you’ll discover how PowerBI can revolutionize the way you analyze and present data.
- Career Advancement Opportunities: Mastering PowerBI opens doors to exciting career opportunities. Employers value professionals who can leverage the power of data visualization to drive informed decisions. By becoming proficient in PowerBI, you’ll position yourself for career growth and advancement in the data-driven world.
- Comprehensive Coverage and Self-Paced Learning: Our course ensures comprehensive coverage of PowerBI’s capabilities. You’ll learn how to connect to various data sources, clean and transform data, create visually stunning reports and dashboards, and leverage advanced features for enhanced data visualization
This PowerBI video course includes labs
Lab #1: Introduction to Business Intelligence
This comprehensive lab offers step-by-step guidance on loading, transforming, and visualizing datasets in Power BI. Here’s what you can expect
- Detailed guidance on loading data from Excel workbooks and CSV files into Power BI.
- Step-by-step instructions on performing data transformations using Power Query.
- Learn how to change data types, replace errors, and manipulate columns effectively.
- Understand the process of grouping data by specific criteria, such as order date.
- Explore the ability to split columns based on delimiters or a specific number of characters.
- Gain hands-on experience in creating visualizations like cards, bar charts, and tree maps.
- Discover how to publish your reports to the Power BI service for easy sharing and collaboration.
- Create interactive dashboards by pinning your visuals and organizing them effectively.
- Gain insights into additional features such as sharing, collaboration, and mobile optimization.
In this lab, you’ll assume the role of a data analyst or a business intelligence professional to perform tasks such as loading and transforming datasets, analyzing and visualizing data, and creating meaningful reports and dashboards using Power BI.
Upon completion of the lab, you’ll have the skills to load and transform datasets in Power BI using Power Query and publish your reports to the Power BI service for easy sharing and collaboration
Lab #2: How to Clean Data in Power BI and Power Query
This comprehensive lab provides step-by-step guidance on loading, cleaning, transforming, and preparing data for analysis using Power BI and PowerQuery, an ETL tool that extracts, transforms and loads data. Here’s what you can expect:
- Detailed step-by-step guidance on loading, cleaning, transforming, and preparing data for analysis in PowerQuery
- Practical exercises that allow you to apply the techniques and tools taught in the lab.
- Learning how to navigate the Power Query Editor and use its features effectively.
- Understanding data profiling tools to analyze and clean data.
- Creating calculated columns and performing conditional transformations.
- Merging datasets and removing duplicates for data consolidation.
- Gaining hands-on experience in preparing data for analysis using Power Query.
In this lab, you’ll assume the role of a data analyst tasked with preparing data for analysis using Power BI.
Upon completion of the lab, you’ll have the skills to effectively load, clean, transform, and prepare data for analysis using Power BI. You’ll use the PowerQuery Editor. You’ll be equipped to handle various data sources, apply data profiling techniques, perform data type conversions, remove errors and duplicates, create calculated columns, merge datasets, and confidently prepare data for insightful analysis and visualization in Power BI.
Lab #3: Introduction to DAX
This comprehensive lab provides step-by-step guidance for beginners to learn and practice the fundamentals of the DAX language in Power BI. Here’s what you can expect:
- Creating calculated columns using DAX formulas.
- Creating calculated measures using variables, date functions, and aggregation functions.
- Utilizing table functions and iterators to create measures and calculated tables.
- Applying the SUM function to calculate totals and aggregates.
- Using the FILTER function to create calculated tables with specific criteria.
- Understanding the concepts of row context and filter context in DAX evaluation.
- Developing confidence in creating DAX expressions for data analysis and visualization in Power BI.
Upon completion of the lab, you’ll have the skills to create calculated columns and measures using DAX formulas.
These skills will empower you to leverage the DAX language effectively, perform calculations, manipulate data, and filter data sets to generate meaningful insights and reports in Power BI.
Lab #4: Designing a Data Model
This comprehensive lab provides step-by-step guidance to help users navigate through the process of designing a data model in Power BI, ensuring a clear and structured approach from start to finish. Here’s what you can expect:
- Data model design and table relationships.
- Creation of calculated tables using DAX expressions.
- Implementation of calculated columns for additional data derivation.
- Creation of calculated measures for performing calculations on specific metrics.
- Configuration of model properties, including object names, descriptions, column formatting, and data types.
The capstone challenge in this lab involves designing a data model in Power BI for a sporting goods store, creating relationships, calculated columns, and measures, and configuring model properties to analyze and visualize sales trends effectively.
Upon completion of the lab, you’ll have the skills to design and create a comprehensive data model in Power BI, establish relationships between tables, create calculated tables, columns, and measures, and configure model properties for effective data analysis and visualization.
Lab #5: Create Your First Dashboard
This comprehensive lab offers a detailed and structured approach, guiding participants through each step of the process, to effectively create a dashboard using Power BI. Here’s what you can expect:
- Step-by-step guidance on data visualization in Power BI
- Focus on creating your first dashboard
- Learn dashboard composition best practices
- Build the dashboard using different visuals
- Utilize the Power BI service to pin visuals from various sources
- Learn how to edit tile settings and change dashboard themes
- Engage in practice activities and a capstone project to enhance your skills
In this lab, you’ll assume the role of a Power BI user or a data visualization practitioner to create and design effective dashboards using Power BI. Upon completion of the lab, you’ll have the skills to create visually appealing and informative dashboards using Power BI.
In the world of data analysis, Excel remains an essential tool. Our course is carefully designed to provide you with the practical skills, real-world applications, and comprehensive knowledge required to excel in data analysis using Excel.
- Gain Practical Skills through Hands-on Experience: Gain hands-on experience by working on real-world data analysis projects, exercises, and case studies. You’ll learn how to manipulate and analyze data effectively, leveraging Excel’s powerful functionalities for data analysis tasks.
- Clear Explanation of Complex Concepts: Our instructors excel at explaining complex Excel functionalities in a clear and accessible manner. You’ll dive deep into Excel formulas, functions, pivot tables, data visualization, and advanced techniques, mastering them to become a proficient data analyst.
- Real-world Applications: Learn how to apply Excel to real-world data analysis scenarios. From data cleaning and transformation to advanced data analysis techniques, you’ll discover how Excel can help you derive valuable insights and make informed decisions based on data.
- Career Advancement Opportunities: Excel skills are highly sought after in the job market. By mastering Excel for data analysis, you’ll enhance your career prospects and open doors to opportunities in various industries that rely on data-driven decision making.
- Comprehensive Coverage: Our course ensures comprehensive coverage of Excel for data analysis. You’ll explore a wide range of Excel features and tools, including data manipulation, conditional formatting, statistical analysis, and advanced charting, making you a well-rounded data analyst.
This practical Excel video course includes 5 labs
Lab #1: Lists, Filters and Data Validation
This comprehensive lab offers step-by-step guidance on excel lists, filters and data validation. Here’s what you can expect
- Learn the fundamentals of lists in Excel, from creating and organizing data to optimizing efficiency through sorting and filtering techniques
- Explore the power of Excel’s database functions, such as DSum, DAverage, and DCount, to perform complex calculations on your data
- Learn how to apply data validation techniques, including list validation and decimal validation, ensuring your data is accurate and consistent
- Create input and error messages to guide users through data entry, enhancing the overall usability and reliability of your spreadsheets.
- Master the art of importing data from text files and MS Access, and seamlessly export your Excel data to text files for versatile data management.
Upon completion of the projects in the lab, you’ll have the skills to proficiently manage data. They will be able to organize and manipulate lists effectively, use advanced sorting and filtering methods, harness the power of database functions for data analysis, enforce data validation rules, and streamline data import and export processes. These skills are invaluable for professionals and businesses looking to make data-driven decisions and maintain clean and structured data in their spreadsheets.

Lab #2: Charts, Pivot Tables and VLOOKUP
This comprehensive lab provides step-by-step guidance on charts, pivot tables and lookups.Here’s what you can expect:
- Learn to create compelling and informative charts from scratch, including basic chart types, the Chart Ribbon, and data manipulation for stunning visualizations.
- Dive deep into Pivot Tables, understanding their power in data analysis. Discover how to create, format, and customize Pivot Tables for insightful reporting.
- Uncover the secrets of Pivot Table calculations and data grouping techniques to extract meaningful insights from your data.
- Explore the synergy between Pivot Tables and Pivot Charts, allowing you to present data dynamically and visually for better decision-making.
- Master essential functions like VLOOKUP, HLOOKUP, INDEX, MATCH, FV, and PMT for data retrieval and financial analysis, enhancing your Excel proficiency.
- Learn how to use Text to Columns to efficiently parse and manipulate text data, a crucial skill for working with diverse datasets.
Upon completion of the projects in the lab, you’ll have the skills create impactful charts, harness the full potential of Pivot Tables for data analysis and reporting, perform advanced calculations, visualize data with Pivot Charts, manipulate data using functions like VLOOKUP, INDEX, MATCH, FV, and PMT, and efficiently handle text data with Text to Columns. These skills will empower you to excel in data-driven tasks, making you a valuable asset in the world of business analytics and beyond.
Lab #3: Conditional Formulas and Advanced Functions
This comprehensive lab offers step-by-step guidance on Excel Conditional Formulas and Advanced Functions. Here’s what you can expect:
- Learn how to efficiently manage and apply named ranges, saving you time and making your formulas more intuitive.
- Explore the simple IF function and discover how to create complex logical conditions with IF, AND, and OR functions.
- Dive deep into nested formulas, allowing you to create intricate calculations and solve complex problems within your spreadsheets.
- Harness the capabilities of CountIF, CountIFs, SumIF, and SumIFs functions to quickly analyze and summarize data.
- Elevate your data retrieval skills with advanced VLookUp and Index Match functions, enabling you to find and match data more efficiently.
- Discover how to work with dates effectively and use functions like Replace and Substitute to clean and format your data seamlessly.
Upon completion of the projects of this lab, you’ll have the skills to streamline your Excel workflows, making you a more efficient and effective spreadsheet user. You’ll be able to create complex calculations, manage data effortlessly, and perform advanced data lookups and transformations, allowing you to excel in both professional and personal spreadsheet tasks. This course will empower you to tackle real-world data challenges with confidence and precision.
Lab #4: Text Based Functions and What IF Tools
This comprehensive lab provides step-by-step guidance on Excel Text Based Functions and What IF Tools. Here’s what you can expect:
- Learn how to effortlessly extract, combine, and manipulate text using Excel’s powerful LEFT, RIGHT, MID, SEARCH, CONCATENATE, and more functions.
- Explore the versatility of the INDIRECT function, both static and dynamic, to create flexible and interactive spreadsheets that adapt to changing data.
- Dive into the world of What-If Analysis with Goal Seek, where you’ll discover how to set and achieve precise targets in your data-driven decisions.
- Harness the potential of Data Tables to perform extensive data modeling, enabling you to visualize and analyze various scenarios quickly.
- Learn to create, manage, and compare multiple scenarios effortlessly with Scenarios, a vital tool for strategic planning and decision-making.
- Uncover the potential of Solver, a tool that helps you find the optimal solution to complex problems, making your workflow more efficient and effective.
Upon completion of the project in this lab, you’ll have the skills to perform advanced Excel functions and What-If Tools, empowering you to streamline data manipulation, make informed decisions based on various scenarios, and optimize your spreadsheet tasks for enhanced productivity. These skills are invaluable for professionals seeking to excel in data analysis and business intelligence.
Lab #5: Create an Advanced Dashboard in Excel
This comprehensive lab offers step-by-step guidance on Excel Advanced Pivot Tables and how to create an advanced dashboard. Here’s what you can expect
- Gain proficiency in efficiently managing and preparing large datasets, ensuring your data is clean and ready for analysis
- Learn how to convert raw data into structured Excel tables, making it easier to work with and ensuring data integrity.
- Acquire advanced pivot table skills to analyze data across various dimensions, unlocking powerful insights and trends.
- Discover the art of creating visually appealing and interactive column charts that adapt to your data, enhancing data visualization and understanding.
- Master the art of assembling a professional dashboard, combining multiple pivot tables and charts into a cohesive, user-friendly interface.
- Provide users with an interactive experience through slicers, allowing them to filter and explore data effortlessly, making your dashboards more engaging and useful.
Upon completion of the project of this lab, you’ll have the skills to manage, analyze, and visualize complex data sets. You’ll be equipped to create dynamic dashboards that facilitate data-driven decision-making, making you a valuable asset in the world of data analysis and reporting.
Python expertise is in high demand in today’s data-driven job market. According to recent industry reports, job postings requiring Python skills have seen a significant increase, with an average annual salary range of $90,000 to $140,000. By mastering Python, you’ll position yourself for career growth and advancement in roles such as data analyst, machine learning engineer, data scientist, or software developer.
Here’s what you can expect from this Python Mastery course:
- Gain Practical Skills through Hands-on Experience: Gain hands-on experience through interactive exercises and real-world projects. You’ll learn how to leverage Python to start automating processes and data analyses.
- Clear Explanation of Complex Concepts: Our instructors are experts at explaining complex concepts in a clear and concise manner. You’ll dive deep into Python basic data structures and flow features, learning how to create custom functions, data analyses and statistical modeling.
- Real-world Applications: Explore real-world applications of Python programming and data analysis. From business analytics and sales reporting to data-driven decision making, you’ll discover how Python can revolutionize the way you analyze and present data.
- Career Advancement Opportunities: Mastering Python opens doors to exciting career opportunities. Employers value professionals who can leverage the power of Python to drive informed decisions. By becoming proficient in Python, you’ll position yourself for career growth and advancement in the data-driven world.
- Comprehensive Coverage and Self-Paced Learning: Our course ensures comprehensive coverage of Python’s capabilities to analyze data and create statistical models.
This practical Python video course includes 4 labs
Lab #1: Python Fundamentals and Functions
This comprehensive lab offers step-by-step guidance on Python fundamentals and functions. Here is what you can expect:
- Learn the core building blocks of Python, from math operators to strings, variables, and basic program structure.
- Dive into data types and functions like Type, Len, Str, Int, and Float to manipulate and analyze data effectively.
- Understand the power of control statements like IF, ELSE, ELIF, and loops such as While and FOR to create dynamic programs.
- Explore the world of functions, including defining, using, and managing local and global variables within them.
- Apply your knowledge to real-world coding challenges like guess the number, reverse a string, and calculate the area of a circle.
- Hone your problem-solving abilities by tackling tasks like creating a simple Python calculator and finding the largest number among three values.
- Develop a strong foundation in Python that prepares you for data analysis tasks, as you’ll learn the fundamental skills needed to manipulate and analyze data, making it a valuable resource for those aspiring to work with data in various fields.
Upon completion of the proejct of this lab, you’ll be equipped with the essential skills to write Python programs, manipulate data, make decisions with IF statements, create loops, define and use functions effectively, and solve various programming challenges. Whether you’re a beginner or looking to enhance your Python skills, this course will empower you to tackle a wide range of coding projects with confidence.
Lab #2: Lists, Tuples and Dictionaries
This comprehensive lab provides step-by-step guidance on Python lists, tuples and dictionaries. Here’s what you can expect:
- Learn the ins and outs of Python lists and tuples, from their creation to advanced manipulation techniques. Discover how to efficiently work with these data structures to store and organize your data.
- Dive deep into dictionaries, a powerful data structure in Python. Understand how to work with keys, values, and items, and harness the flexibility of dictionaries for various programming tasks.
- Explore how to manipulate lists efficiently with operations like appending, inserting, removing, and sorting. Gain the skills to optimize your code when working with lists of all sizes.
- Unlock the potential of dictionary comprehensions. Learn how to create and manipulate dictionaries with concise, Pythonic syntax, making your code cleaner and more readable.
- Elevate your string manipulation skills with a comprehensive overview of functions like upper(), lower(), isupper(), islower(), split(), strip(), join(), startswith(), and endswith(). Enhance your text processing capabilities for various applications.
- Throughout the course, apply your newfound knowledge to real-world scenarios and coding exercises. By the end, you’ll be equipped with the skills to tackle a wide range of data manipulation tasks in Python.
Upon completion of projects of this lab, you will have a strong command of Python’s fundamental data structures: lists, tuples, and dictionaries. You’ll be able to create, manipulate, and optimize lists efficiently, harness the power of dictionaries for data organization, and perform advanced string manipulations. Whether you’re a beginner looking to build a solid Python foundation or an experienced programmer aiming to sharpen your skills, this course will empower you to write cleaner, more efficient Python code for your projects.
Lab #3: Data Analysis and Statistical Modeling in Python
This comprehensive lab offers step-by-step guidance to data analysis and statistical modeling in Python. Here’s what you can expect:
- Learn to compute summary statistics for numerical columns, providing a solid foundation for data exploration and understanding.
- Discover methods to identify and deal with missing values, ensuring your analysis is robust and complete.
- Understand the importance of outlier detection, and use techniques like box plots and IQR to manage outliers effectively.
- List Item
- Calculate skewness and kurtosis for numerical variables, setting thresholds for identifying skewed data.
- Visualize data distributions using histograms and Seaborn’s distplot, and explore relationships with scatter plots and regression lines.
- Delve into multivariate analysis with Seaborn’s Pairplot and examine correlations using heatmap visualizations.
- Dive into advanced statistical modeling techniques, including ANOVA and independent T-tests using the statsmodels library.
- Learn the art of predictive modeling with linear regression for numeric outcomes and logistic regression for classification tasks, using both scikit-learn and statsmodels.
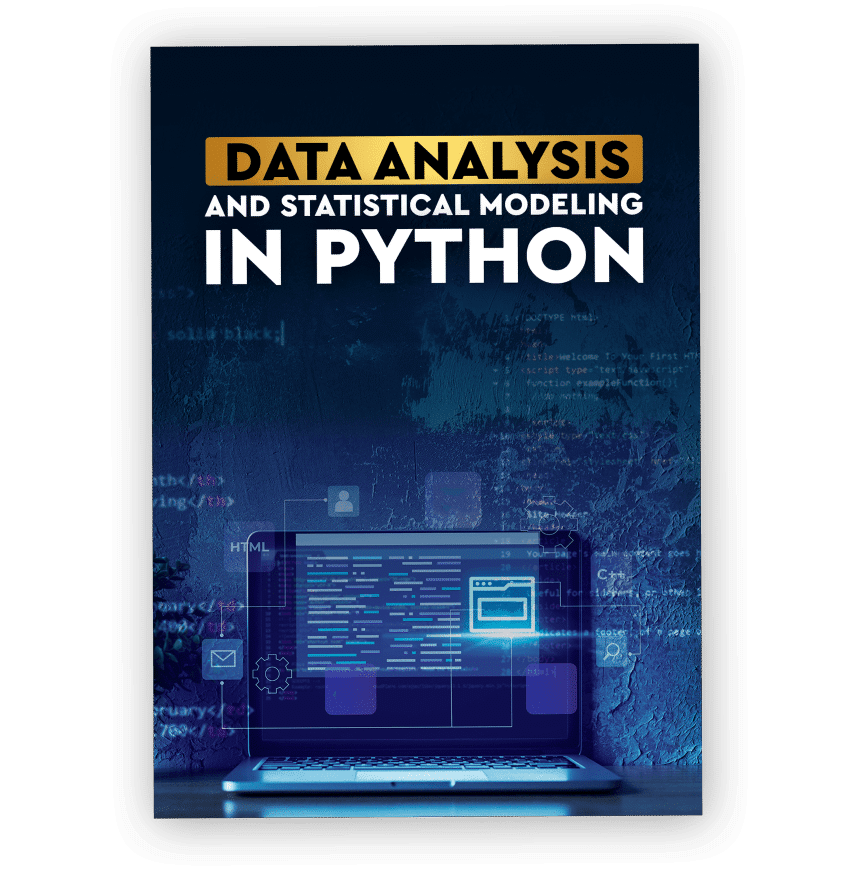
Upon completion of the real-world projects of this lab, you’ll have will possess a strong foundation in Python data analysis and statistical modeling. You will be equipped with the skills to explore data, detect anomalies, perform advanced statistical tests, and build predictive models. Additionally, you will be proficient in linear and logistic regression modeling, enabling them to make data-driven predictions and decisions in various real-world scenarios. Whether you’re a data analyst, scientist, or enthusiast, this course will empower you to extract valuable insights and make informed decisions from your data.
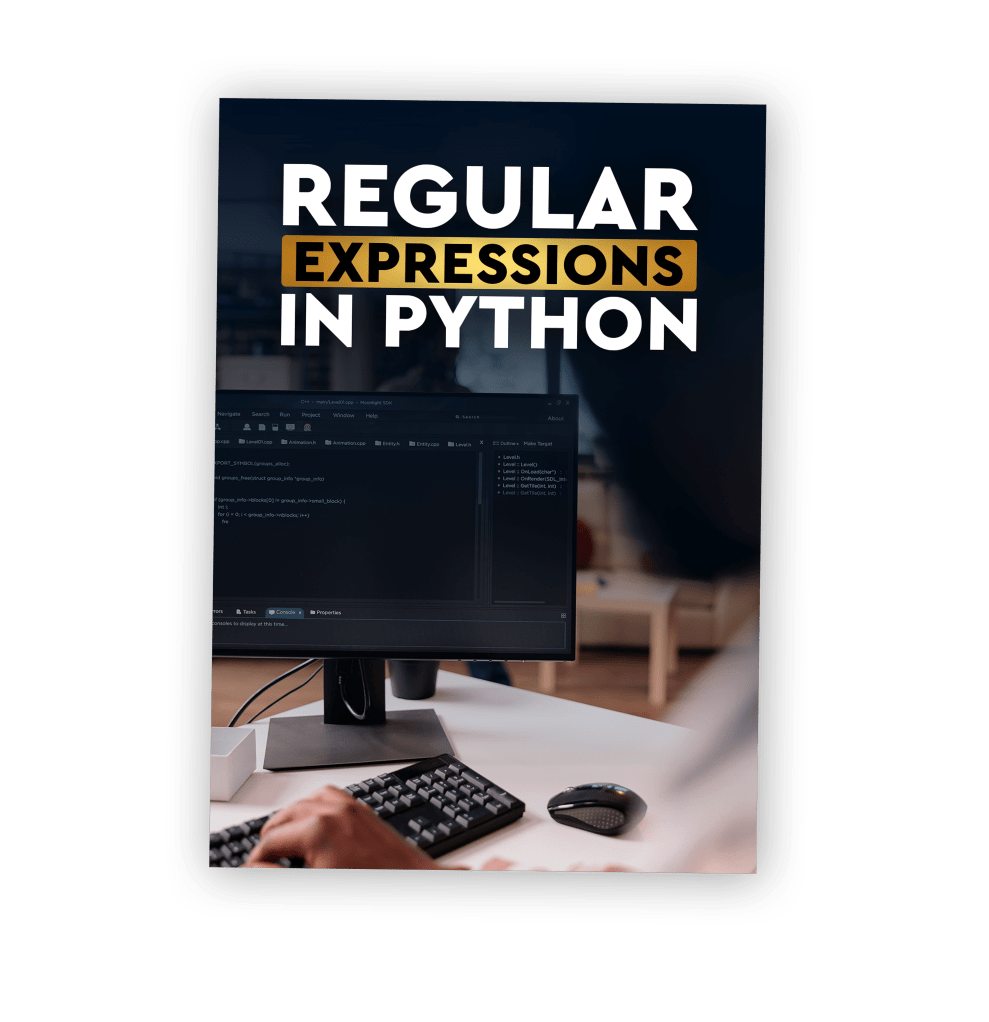
Lab #4: Regular Expressions in Python
This comprehensive lab provides step-by-step guidance on using regular expressions in Python. Here’s what you can expect:
- Learn to construct powerful regex patterns for searching, matching, and manipulating text effectively. This skill is invaluable for data manipulation and text processing tasks.
- Discover how to use regex to validate passwords, ensuring they meet specific criteria for security. Gain the ability to implement robust authentication systems in web applications.
- Explore the use of regular expressions to validate user input in web forms, ensuring data accuracy and preventing malicious inputs. This skill is essential for building robust and secure web applications.
- Learn how to extract valuable information from text by identifying and extracting patterns. Additionally, discover how to replace specific strings with regex, making data transformation tasks more efficient.
- Dive into essential regex syntax elements, including metacharacters, quantifiers, special sequences, and sets. Understanding these elements will empower you to create complex patterns for various purposes.
- Get hands-on experience using Google Colab, a user-friendly Jupyter notebook environment that requires no setup and provides access to computing resources like GPUs. This practical skill enhances your ability to work with regular expressions in a real-world context.
Upon completion of the projects lab, you’ll have acquired the essential skills needed to harness the power of regular expressions in Python. You will be proficient in constructing intricate regex patterns, validating passwords and user inputs, extracting valuable information, and efficiently replacing strings.
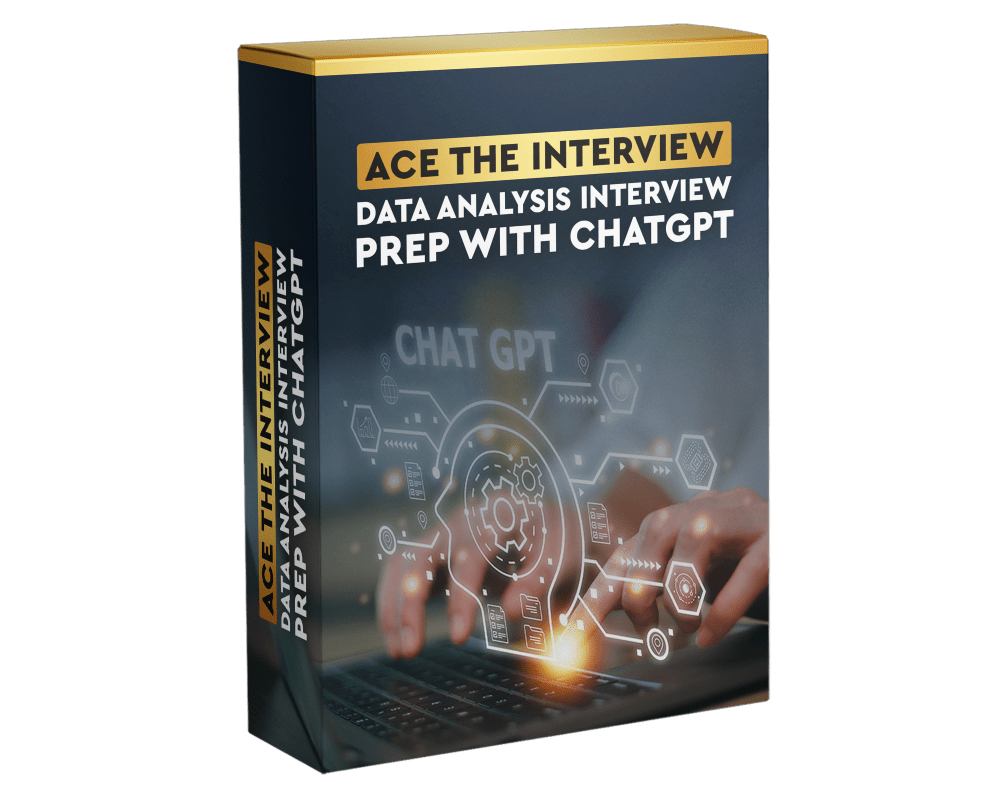
After completing this course, you will possess the skills to confidently navigate data analyst interviews, mastering the art of utilizing ChatGPT for prompt engineering and interview preparation. You’ll be well-prepared to research companies, excel in HR interviews, impress technical managers, and deliver compelling presentations, making you a top candidate for data analyst positions in any organization. Join us on this journey to become a proficient data analyst interviewee! Here is what you can expect:
- Understanding Large Language Models: Delve into the world of Large Language Models (LLMs). Learn how they work, how they are trained, and gain insights into their capabilities for interview preparation.
- Categories and Patterns: Understand the various categories of prompt patterns and their names. Learn how to use these patterns to create engaging and realistic interview simulations.
- Applying Prompt Patterns for Interview Simulation: Learn the art of crafting effective prompts to simulate interview scenarios, ensuring you can extract valuable insights from these models during interviews.
- Developing Effective Interview Techniques: Hone your interview skills by leveraging large language models to answer questions with data-driven insights, setting yourself apart as a standout data analyst candidate.
- Prompt Patterns for Four-Part Interview Preparation: Discover prompt patterns to prepare for each phase of a data analyst interview process, from researching the company to presenting to managers.
- Practical Application: Engage in practical exercises to develop prompt creation skills. Practice using patterns to refine dialogues and reach desired outcomes in interview simulations.
- Mastering Interview Techniques: Focus on honing your interview techniques with the help of LLMs. Learn how to provide data-driven and insightful answers, showcasing your analytical prowess as a data analyst candidate.
- 100 Interview Preparation Prompts: Access a comprehensive collection of interview preparation prompts designed to help you practice and refine your interview skills. These prompts cover various interview scenarios, allowing you to tailor your practice to specific roles and industries.
By the end of the course, you’ll be well-prepared to excel in data analyst interviews, armed with the skills to confidently navigate interviews and leverage ChatGPT as a valuable tool.

By mastering ChatGPT as a tool in your resume-writing arsenal, you’ll have the confidence and skills needed to create ATS-friendly resumes that truly stand out. This course empowers you to leverage artificial intelligence to your advantage, helping you secure more job interviews and take significant strides in your career. Here is what you can expect:

- Learn the ins and outs of Applicant Tracking Systems through real-world Q&A sessions, ensuring you understand how to navigate this crucial aspect of the job application process.
- Leverage ChatGPT for Success: Discover how to harness the power of ChatGPT to craft ATS-friendly resumes and transform your skills and coursework into compelling narratives that resonate with employers.
- Seamless Transition to Data Analysis: Gain valuable insights on how to tailor your existing experience to excel in data analysis roles, leveraging ChatGPT’s assistance to bridge the gap effectively.
- 8 Proven ATS Resumes: Access a comprehensive bank of 8 ATS-optimized resumes and cover letters, carefully designed for professionals transitioning to new career paths, providing you with real-world examples of success.
- Keyword Optimization Strategies: Learn the art of strategically incorporating keywords and phrases into your resume, increasing your chances of passing through ATS filters and reaching human recruiters.
- Gain insights into using ChatGPT to adapt your resume for different job positions and industries, making it versatile and appealing to a wide range of employers.
- Discover techniques to collaborate with ChatGPT in generating engaging and persuasive resume content that highlights your skills, experiences, and qualifications.

“Cracking the Data Analyst Interview” is a comprehensive guide designed to equip aspiring data analysts like you with the tools and knowledge you need to excel in the highly competitive world of data analysis. This comprehensive book bundle packed with 150 technical questions and answers, 30 conceptual questions and answers, as well as 30 situational and behaviorsal questions and answers on data analysis. The questions cover a wide range of topics, including SQL, Python, Excel, R, advanced SQL, data manipulation, machine learning, deep learning, natural language processing, time series analysis, causal inference, computer vision data analysis, statistical analysis, data transformation, data visualization, and more. Here is what you can expect:
- Technical Mastery: With 150 questions and answers divided into beginner, intermediate, and advanced levels, you’ll gain a deep understanding of various data analysis concepts. Master advanced SQL, data manipulation techniques, machine learning algorithms, statistical analysis methods, and other essential skills.
- Conceptual Clarity: The bonus also includes 30 conceptual questions and answers to solidify your understanding of fundamental data analysis concepts. These questions will help you navigate through conceptual challenges and develop a well-rounded knowledge base.
- Behavioral and Situational Interview Success: In addition to technical questions, we provide 30 situational and behavioral questions. With step-by-step instructions and code examples in Python, SQL, Excel, and R, you’ll be equipped to tackle these interview scenarios confidently and effectively.
- Additional Guides for Further Proficiency and Interview Readiness: We’ve created five additional guides that delve deeper into specific areas: SQL, Python, Excel, R, and PowerBI. Each guide includes 150 questions and answers, categorized into beginner, intermediate, and advanced levels. These guides will enhance your expertise in each respective area, ensuring you’re fully prepared for any interview challenge.
But we’re still not done. The Data Analyst Toolkit gives you even MORE ways to enhance your skills, break into and stay at the forefront of this dynamic and evolving field.
I really want you to love this.
BONUS #1
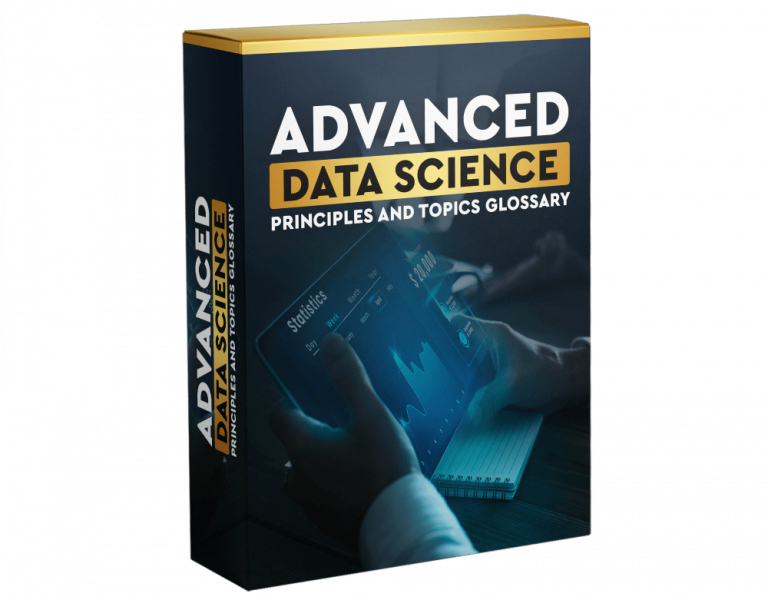
Advanced Data Science Principles and Topics Glossary
This Topics Glossary serves as a comprehensive and invaluable resource, addressing a wide spectrum of topics that encompass both foundational and advanced elements in the realms of data analysis, programming, and technology utilization.
It offers readers an opportunity to gain a multifaceted skill set, making them proficient in key areas crucial for effective data analysis and application.
Here is what you can expect:

- Comprehensive Coverage: The glossary spans an extensive range of subjects, encompassing statistical fundamentals, programming proficiency, and advanced domain-specific insights.
- Linguistic Diversity: It emphasizes the mastery of critical programming languages, with a strong focus on Python, R, and VBA for Excel, ensuring readers can work seamlessly with data across different platforms.
- Exploration of Leading-edge Topics: Readers are provided with a deep dive into contemporary areas such as machine learning, artificial intelligence, data engineering, natural language processing, big data technologies and advanced data visualization, equipping them to tackle complex challenges.
- Establishing Strong Foundations: Foundational principles of data analysis and statistical techniques are explained thoroughly, ensuring a strong knowledge base.
- Technological Proficiency: Concepts related to the web, database systems, data warehousing, data engineering and operating systems are explored, cultivating a well-rounded understanding of technology’s role in data analysis.
- Excel Automation and Efficiency: Practical skills in VBA for Excel are offered, empowering readers to streamline data management, automate repetitive tasks, and enhance their data analysis capabilities.
- Data Management Expertise: The glossary delves into topics concerning data storage options and essential computing basics, fostering competency in data handling.
- Versatility and Adaptability: Above all, this resource equips readers with a versatile skill set that makes them adaptable and proficient in diverse data-related roles.
In your journey to becoming a data-savvy professional, this Topics Glossary stands as a comprehensive guide, bridging the gap between the fundamentals and advanced knowledge, ultimately shaping you into a versatile and adept practitioner in the dynamic fields of data analysis and technology application.
BONUS #2
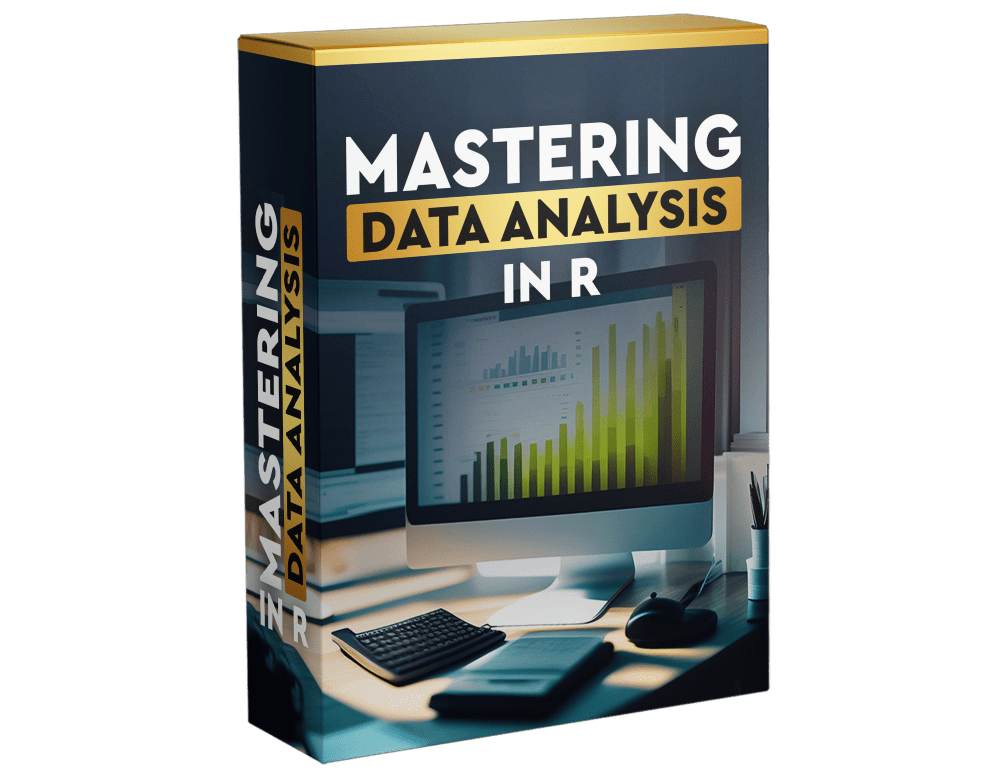
Mastering Data Analysis in R
“Master Data Analysis with R: Unlock Insights and Make Data-Driven Decisions with Ease!” is a comprehensive course designed to equip you with practical skills and comprehensive knowledge for proficient data analysis using R.
The course offers hands-on experience, clear explanations of complex concepts, real-world applications, and comprehensive coverage of R for data analysis.
Here is what it will do for you:

- Exploratory Data Analysis: You’ll gain a deep understanding of exploratory data analysis. Take control of messy datasets with techniques such as data selection, calculation, pivoting, mutating, and handling missing values. Discover basic and advanced EDA techniques, automate your EDA reports, and explore data using tools like Tidyverse, dlooker and DataExplorer.
- Hands-on Labs: Learners will complete four hands-on labs covering essential skills, enhancing their ability to manipulate, visualize, and analyze data effectively. engage in interactive exercises, projects, and real datasets to gain practical experience, enabling them to tackle complex data analysis challenges effectively.
- Real-World Application: The course demonstrates how R can be applied to real-world data analysis scenarios, covering data preprocessing, transformation, exploratory data analysis, and statistical modeling. This practical knowledge empowers learners to uncover insights and drive data-driven decision-making.
- Comprehensive Coverage: It provides comprehensive coverage of R for data analysis, encompassing topics such as data manipulation, data visualization, statistical analysis, and predictive modeling. This ensures participants become well-rounded data analysts.
- Career Advancement: Acquiring R skills for data analysis opens doors to exciting career opportunities. Employers highly value individuals who can leverage R to extract meaningful insights from data. This course positions learners for career growth and advancement in the data-driven world.
After completing this course, you will have gained practical experience in using R for data analysis and visualization. You will possess the ability to manipulate data, import various data types, clean and transform data effectively, and perform exploratory data analysis. These skills will empower you to make data-driven decisions, extract meaningful insights from data, and communicate these insights effectively, enhancing you employability and advancing your career in the data-driven landscape.
BONUS #3
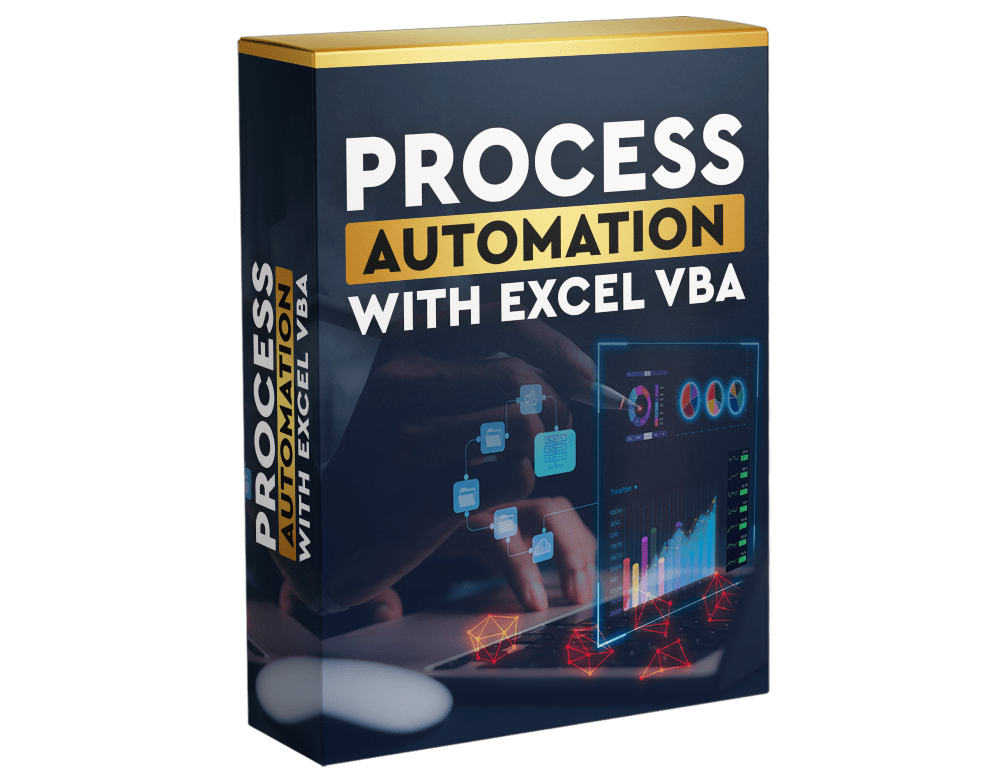
Process Automation With Excel VBA
Are you ready to supercharge your Excel skills and become a VBA automation expert?
Our Excel VBA Automation course takes you through a comprehensive journey, equipping you with the tools and knowledge needed to streamline your Excel tasks.
Here’s a sneak peek at what you’ll learn:
- Understanding VBA: Delve into the fundamentals of VBA, including Object-Oriented Programming, setting the stage for your Excel automation journey. You’ll gain a deep understanding of how VBA empowers you to automate Excel tasks, making you more efficient and productive.
- Macro Mastery: Master the art of Macros with lessons on initial setup, recording, and saving Macros to automate repetitive tasks. Say goodbye to tedious, time-consuming actions in Excel as you become proficient in Macro creation.
- VBA Environment: Navigate the VBA environment with ease, from launching VBA and using the VB Editor to creating custom menus and naming projects. You’ll feel at home in the VBA environment, ready to take on any automation challenge.
- Programming Foundations: Build a solid foundation in programming with lessons on variables, procedures, message boxes, and input boxes. You’ll also explore basic navigation, working with sheets, and cell manipulation. These skills will lay the groundwork for advanced automation.
- Automation Essentials: Discover the power of automation as you dive into operators, loops, IF statements, and Select Case, enabling you to automate complex Excel operations effortlessly. You’ll transform into a data manipulation virtuoso, saving valuable time.
- Debugging Techniques: Learn essential debugging techniques to troubleshoot and refine your VBA code effectively. Debugging is an art, and you’ll become a master at identifying and fixing issues in your code.
- User-Defined Functions (UDFs): Harness the potential of UDFs to create custom functions and shortcuts to boost your productivity. With UDFs, you’ll customize Excel to work exactly the way you need it to.
- Practical Exercises: Apply your newfound skills with hands-on exercises that include recording Macros, duplicating data, generating reports, and mastering inner and outer loops. These exercises will reinforce your learning and help you build confidence in your automation abilities.
- Form Controls: Explore form controls, learn how to build interactive forms, initialize them, and implement command buttons to create user-friendly Excel applications. You’ll not only automate tasks but also create user-friendly interfaces that make working with Excel a breeze.
By the end of this course, you’ll have gained proficiency in Excel VBA automation, allowing you to streamline repetitive tasks, manipulate data efficiently, and create user-friendly interfaces to enhance your productivity in Excel. Whether you’re a beginner looking to automate simple tasks or an advanced user seeking to optimize complex processes, this course will equip you with the knowledge and practical experience needed to excel in Excel VBA automation.
BONUS #4
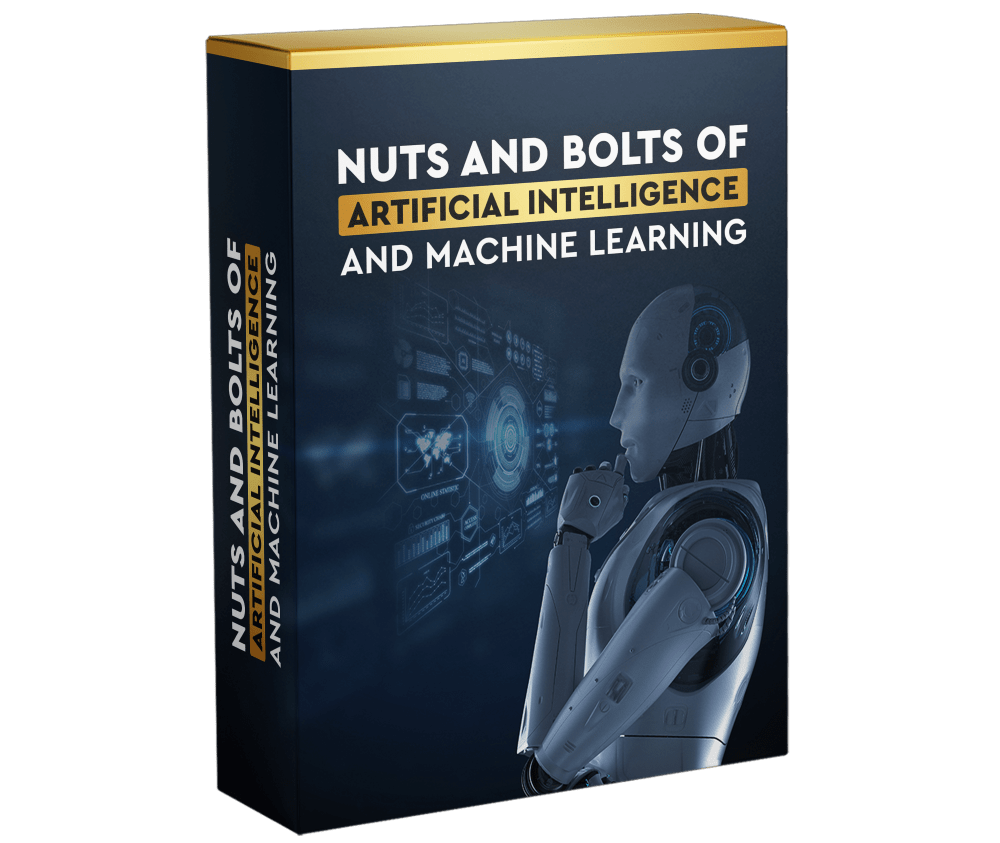
Nuts and Bolts of Artificial
Intelligence and Machine Learning
In this course, you will embark on an exploratory adventure through the fascinating landscape of AI. You’ll equip yourself with the knowledge and skills needed to navigate this rapidly evolving field.
Whether you’re a novice eager to understand the fundamentals or a seasoned professional seeking to stay ahead in the AI revolution, this course promises to be your guiding light.
Here is what you can expect:
- Building a Foundation: Establish a strong foundation to understand key AI concepts like computer vision and machine learning.
- Early AI Techniques: Dive into the initial AI techniques that aimed at solving problems without prior knowledge, exploring their concepts and notable examples.
- Expert Systems: Explore expert systems, which focus on specific problems by utilizing knowledge bases, and understand their successes and limitations.
- Neural Network Evolution: Investigate the early attempts to replicate the human brain through neural networks, identifying missing elements for breakthroughs.
- Multi-Layer Neural Networks: Uncover the pivotal role of multi-layer neural networks in AI, driving advancements in machine learning, machine vision, and speech recognition.
- Practical Applications: Learn about popular frameworks for building AI systems, equipping you with practical skills to implement AI solutions.

BONUS #5
Quizzes, Self-Assessments and Certificates
“The Data Analyst Toolkit” offers a comprehensive learning experience with verifiable certificates and automatic social sharing capabilities. Learners can master a diverse set of tools and languages crucial for data analysis, enhancing their career prospects.
With professional recognition and validation, graduates are well-prepared to excel in the dynamic and competitive field of data analysis, unlocking exciting career opportunities and professional growth.
Here is what you can expect:

- Comprehensive Learning: This course offers more than 30 quizzes and self-assessments, covering programming basics, statistics, SQL, R, Python, Excel, PowerBI, and VBA. Learners receive a well-rounded education in key data analysis tools and techniques.
- Confidence Building: Formative and Summatrive assessments provide learners with opportunities to apply their knowledge, building confidence in their ability to use these tools effectively in real-world scenarios. Successfully completing quizzes and assessments demonstrates learners’ competence in the subject matter, reinforcing their expertise to employers and peers.
- Verifiable Certificates: Upon completion, learners receive verifiable and shareable certificates. These certificates can be authenticated by employers, ensuring the authenticity of their skills and knowledge.
- Automatic Social Sharing: Graduates can easily share their certificates on platforms like LinkedIn and other social media, showcasing their expertise and enhancing their professional online presence.
- Professional Recognition: Completing this course not only equips learners with practical skills but also provides the recognition and validation needed to excel in the competitive world of data analysis, with verifiable certificates to prove their skills, setting them up for success in their professional journey.
Here’s Everything You Get With The Data Analyst Toolkit

- Lab #1: Foundations of Computing and Programming
- Lab #2: Math and Statistics for Data Science
- Lab #3: How to Query Data in Relational Databases
- Lab #4: How to Clean Data in SQL
- Lab #5: Extract & Analyze Data from Databases in SQL
- Lab #6: Create Analyses from Multiple Queries in SQL
- Lab #7: Introduction to Business Intelligence with Power BI
- Lab #8: How to Clean Data in Power BI and Power Query
- Lab #9: Introduction to DAX in Power BI
- Lab #9: How to Design a Data Model in Power BI
- Lab #10: How to Create Your First Dashboard in Power BI
- Lab #11: Excel Lists, Filters and Data Validation
- Lab #12: Excel Charts, Pivot Tables and VLOOKUP
- Lab #13: Conditional Formulas and Advanced Functions in Excel
- Lab #14: Text Based Functions and What IF Tools in Excel
- Lab #15: Create an Advanced Dashboard in Excel
- Lab #16: Python Fundamentals and Functions
- Lab #17: Python Lists, Tuples and Dictionaries
- Lab #18: Data Analysis and Statistical Modeling in Python
- Lab #19: Regular Expressions in Python
- Lab #20: Ace the Interview: Data analysis Interview Prep with ChatGPT
- Lab #21: How to Craft Winning ATS Friendly Resumes with ChatGPT + Templates
- Lab #22: Cracking The Data Analyst Interview Question Banks
- Advanced Data Analytics Principles and Topics Glossary
- Lab #23: Mastering Data Analysis in R
- Lab #24: Process Automation With Excel VBA
- Lab #25: Nuts and Bolts of Artificial Intelligence and Machine Learning
- Quizzes, Self-Assessments and Certificates
100% Risk-Free Money Back Guarantee
We are proud to offer a 60-day money-back guarantee in collaboration with the Data Analyst Toolkit team. This guarantee ensures your satisfaction and allows you to assess the toolkit’s suitability for your needs with confidence. If you find it doesn’t meet your expectations within the 60-day period, you can request a refund, no questions asked. We are committed to your success and are here to assist you in making the most of the Data Analyst Toolkit. Thank you for choosing us as your partner in data analysis.

Place your order here and you get INSTANT ACCESS To the Data Analyst Toolkit
Thank you for taking the time to read about the Data Analyst Toolkit today. Whether you choose to make a purchase or not, I wish you the very best in your pursuit of a successful career in data analysis.
If you ever need guidance or have questions, please feel free to reach out. Thank you again for considering the Data Analyst toolkit, and I hope to be a part of your data analysis journey in the future.
Emmanuel Segui
© 2023 The Data Analyst Toolkit. All rights reserved.